Power BI for IT Operations
- Keegan Brunk-Fraedrick
- Jan 10, 2023
- 6 min read

While not directly intended for IT Operations, Power BI can be a very useful tool to aggregate and visualize information from large datasets into customizable, responsive reports. These reports can then provide clear visual summaries of large datasets, as explained by the powerful analytic and visual options available within Power BI. When setting up this kind of reporting, data is usually pulled from third-party monitoring applications in the form of CSVs, PDFs, or Excel files. While other options exist to import data into Power BI, this article will only be covering these options to limit the scope of this tutorial to focus on Data Organization, Data Modeling, and Basic Report Visualization. The focus of this article is to give a general tutorial on modeling data into a waterfall schema which then can be applied to different IT Operations. Each step illustrates a high-level guide as to how reports are built to utilize cascading relationships among different tables and datasources. Intermediate knowledge of Power BI terms and operations is assumed for this article and most questions can be answered by searching Microsoft's official Power BI documentation: https://learn.microsoft.com/en-us/power-bi/
Overview
Importing Datasources
Data Organization
Data Modeling
Basic Report Visualization
Before starting this project, it is important to understand the steps we will be taking as to better apply this tutorial to your project. It is best practice (for this application of Power BI) to import any dataset(s) using PowerQuery because further column, row, and table manipulation are frequently needed when visualizing data. In addition to this, some visualizations require values to be formatted to specific datatypes which must be done using either the PowerQuery or DAX options. Modeling the dataset(s) into the desired schema, as to properly illustrate downstream and upstream relationships between tables, is then done after organizing the dataset(s) into the desired format. Visualizations for the imported dataset(s) can then be created for the report after all desired data has been imported, organized, and then modeled. Because of this process, it is suggested that any relationships or filtering be planned out before starting this project.
Step 1: Importing Datasources
Reports can be built in a variety of ways to reflect the different environments they represent. This can either be done by importing multiple dataset(s) and transforming each into its respective table(s) or by breaking out one table into multiple tables, as to model the desired relationship. It is best practice to first start out with the most complete and granular datasource before adding smaller datasources, as to build the most complete relationship possible without synthesizing information or adding more datasources. If this is not possible, different mathematical operations and conditional columns can be used to append synthesized information and more datasources can be imported by selecting "New Source” as needed.
Dataset(s) can be imported by selecting the "Get data" menu and selecting the desired datasources to import. It is very important to document this step if future reports with the same datasource are desired. Importing datasources that are not formatted in the same way will result in errors that will require correction.

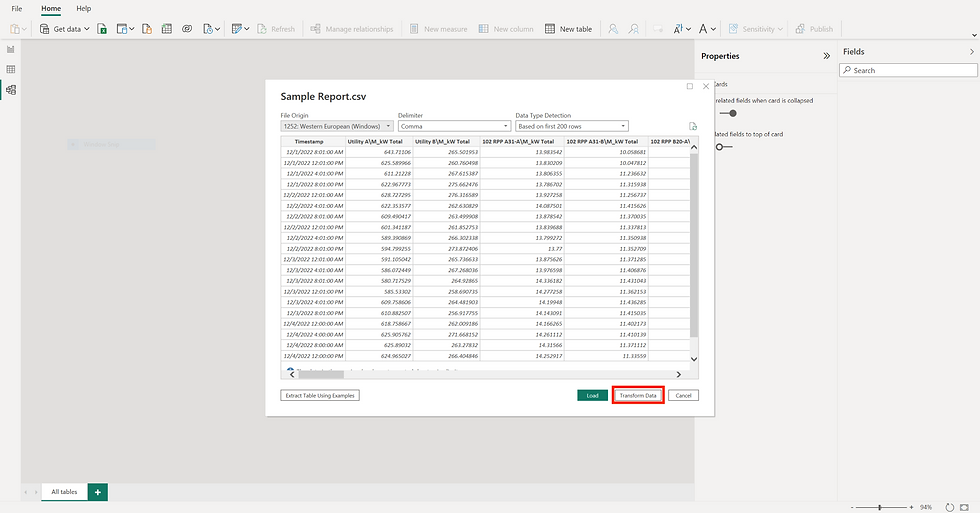
Power BI will automatically detect the imported data and recommend import options, once data type and datasource are selected. These suggestions are usually correct, but they can be changed if needed by selecting the File Origin and Delimiter options as needed. Select the "Transform Data" button at the bottom of the window to transform the imported data and open the Power Query Editor.
If done correctly, the resulting values in the dataset(s) should be separated by device as per the delimiting option in the previous step. If the resulting table has value separation issues, import the affected dataset(s) again with the correct delimiting option selected. With the data imported, we can now begin organizing the resulting table(s) in preparation for appending information and modeling the desired relationships.
Step 2: Data Organization
Having imported dataset(s) into Power BI, we can now start organizing the data and adding any relevant information to the table(s) to start building relationships and assigning filtering options. It is common for this step to take the longest as data needs too be organized to support visual filters, table filters, and desired relationship schema.
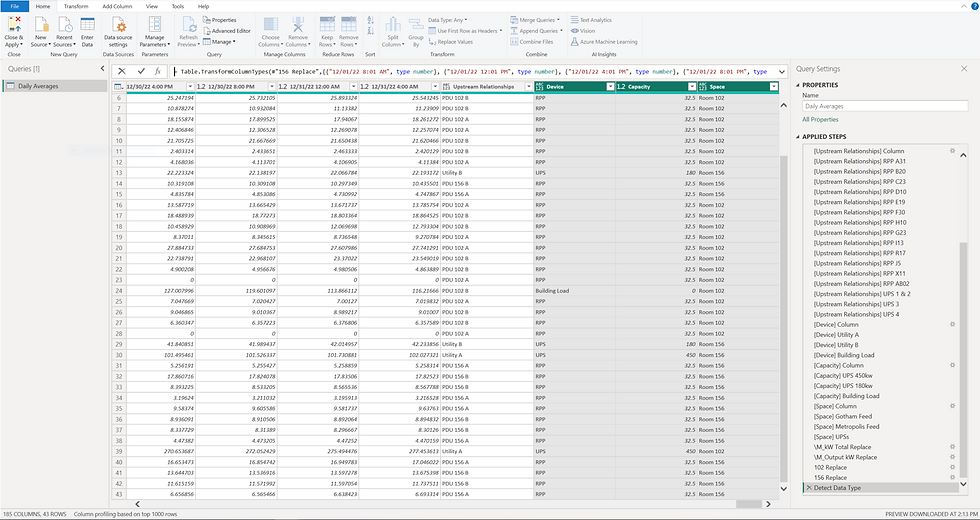
With the Power Query Editor window open, select the report in the Queries tab and begin transforming the table into usable content for visualization. Begin organization by transposing the table (if necessary) into a "Name" column that explains device values over time.

Then create a "Upstream Relationships" column by selecting the Conditional Column button (Add Column tab). Append information into the "Upstream Relationships" column by using the 'contains' Operator and Value to select individual devices. Then list the device name for the upstream relationship in 'Output' - repeat this step as many times as needed.

*NOTE: Problems with modeling relationships are often due to whitespace/syntax errors at this stage.
Information will then be appended into this column from the "Name" column as to build the desired relationship schema. A waterfall relationship schema can now be built by connecting each device based on individual and group upstream relationship. The goal of this column is to build a Parent/Child relationship for every device as to accurately cascade information from one device into another.

Static information about devices can also be constructed by using the aforementioned method. The different “Operators" can be used to great effect when building additional Conditional Columns. These columns can then serve to either filter, group, or act as informational aids.

Step 3: Data Modeling
Once the dataset(s) have been organized in a logical way with Upstream Relationships and any additional information added, data modeling can now begin.
Build new tables from the primary dataset by right-clicking the table and selecting “Reference”. Tables should be logically organized to represent the relationship hierarchy of the waterfall schema relationship model.
Once the primary dataset(s) has/have been referenced, filters and different operations can then be applied to gain the desired result. This process is usually done to help facilitate the logical organization of tables and data within the relationship model.

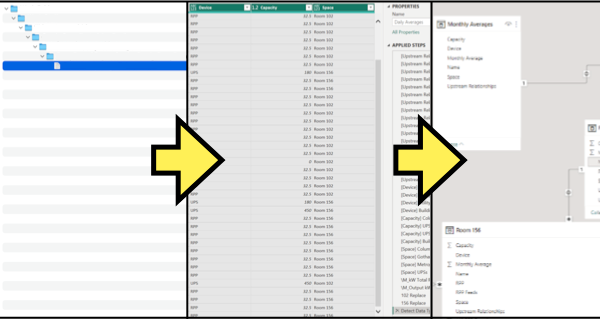
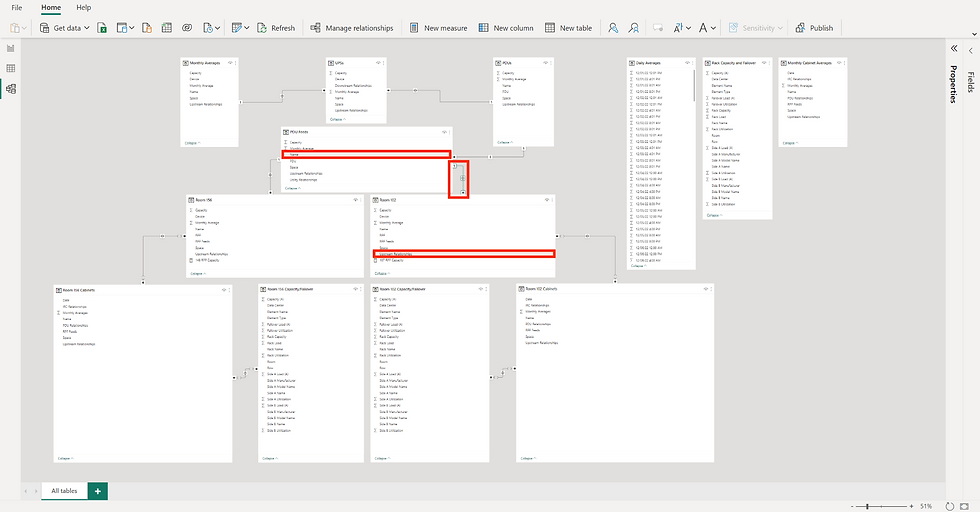
Devices and information can be synthesized at this stage by referencing the primary dataset(s) and then manipulating the table as needed. This is demonstrated in the ‘APPLIED STEPS’ portion of the 'PDUs' table in the image below:

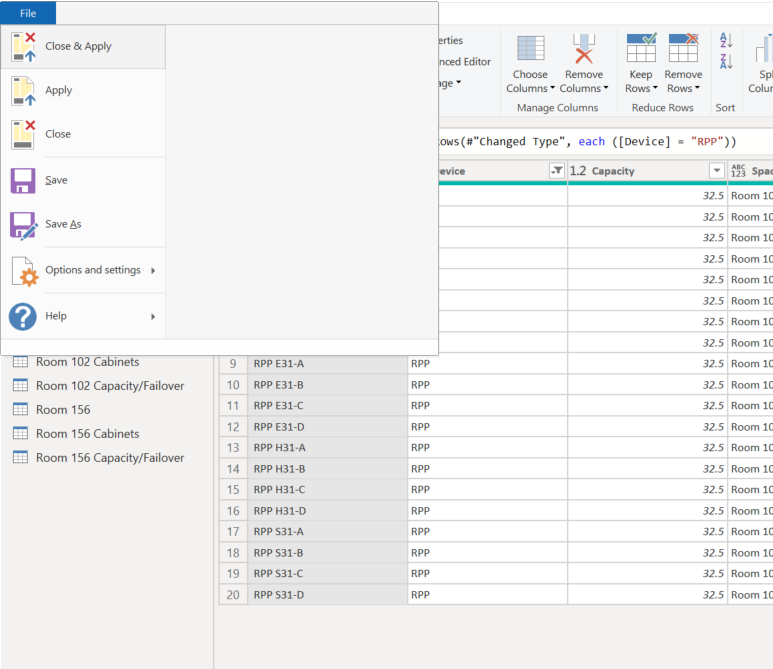
Now that the data has been imported and organized, it is time to start building the waterfall schema data model. Exit the Power Query Editor and save your changes by selecting File and "Close & Apply". Once done, navigate to the Model page to start building the waterfall schema relationship between tables. This is accomplished by clicking and dragging the "Upstream Relationships" column to the parent tables "Name" column.

Active relationships (solid lines) should now logically cascade across tables that require cross table interaction. These connections should be made up of different Many-to-One or Many-to-Many relationships so that the proper interactions are modeled into the waterfall schema.
Once done, the relationships among the different tables should cascade interactions between the tables. These interactions can offer dynamic visual representations of the data while also providing useful cross table drill downs.
If done correctly, the "Upstream Relationships" column in each table will match the "Name" column of its parent. More information can easily be imported and added at this stage if desired. This now means our data is ready for the final step of building a report, visuals.
Step 4: Basic Report Visualization
There is still a fair amount of data manipulation that can happen at this stage of the report. However, I find that it is best practice to do the majority (if not all) of the data manipulation within either the Power Query Editor or DAX. If the "Upstream Relationship" columns and Active Relationships are properly configured, visuals built from one table should now respond to others that share its Active Relationships.
Test the Active Relationships that exist within the waterfall schema for the desired reactions by navigating to the “Report” pages (left top side). Once there, build a pair of basic visuals that should interact with each other based on the Active Relationships that were built in the previous step. The information used in these visuals should be from different tables as to accurately test the existing relationship.

With a successful demonstration of the Active Relationships among the different tables, visuals can now be built. Experiment with visualizing the dataset(s) with the different graphs, sliders, and charts that are available. As each visual can offer a different way to represent the data, information, and relationships within your report. Data analysis can be applied at this stage with several powerful options to choose from.

It is important to note that some analytic options are only available for certain visuals, which then must be formatted for the correct data type. With proper data type formatting and relationship modeling, dynamic cross-table interactions and drill-downs are now available for use in the report!
Comments